
Jul 30, 2025
Innovative Solutions
The phrase “viewer engagement” gets thrown around like we all agree on what it means. But we don’t.
Half the time, it’s shorthand for ratings. Other times, it means social buzz, retention, even YouTube comments. And when the numbers aren’t clear—or worse, not trusted—creative teams fall back on instincts, post loses time zigzagging through notes, and execs don't have the leverage they need to defend what's working.
In unscripted TV, where stories aren’t scripted and run times shift by episode, you need sharper tools to know what hits. Especially once a show is in post and everyone’s guessing what the “best version” is. Engagement metrics should clear that up. Most teams just never see them in a usable form.
What People Usually Get Wrong
Too often, metrics are either too late or too vague to help.
Streaming teams sometimes get a single retention chart, three weeks after drop. Linear folks may only see overnights. That data doesn’t map back to what actually happened on screen—and if it does, it's locked in engineering tools nobody on the creative or post sides ever sees.
So editors keep cutting by instinct. Story producers pitch arcs based on exec notes or anecdotal intel. Showrunners rally around what "felt strong." And that’s fine, until it isn’t. Especially when viewers drop off at act three and nobody knows why.
The mistaken belief is that engagement is abstract—that it can’t be measured precisely, or should only be analyzed after the season wraps. But we’ve seen otherwise. When tracked correctly, engagement tells you where to lean in and what to trim. It doesn't need to feed an algorithm. It just needs to be useful.
What We Actually Built or Changed
Here’s how we reframed engagement—not as a generic KPI, but as a practical tool for post.
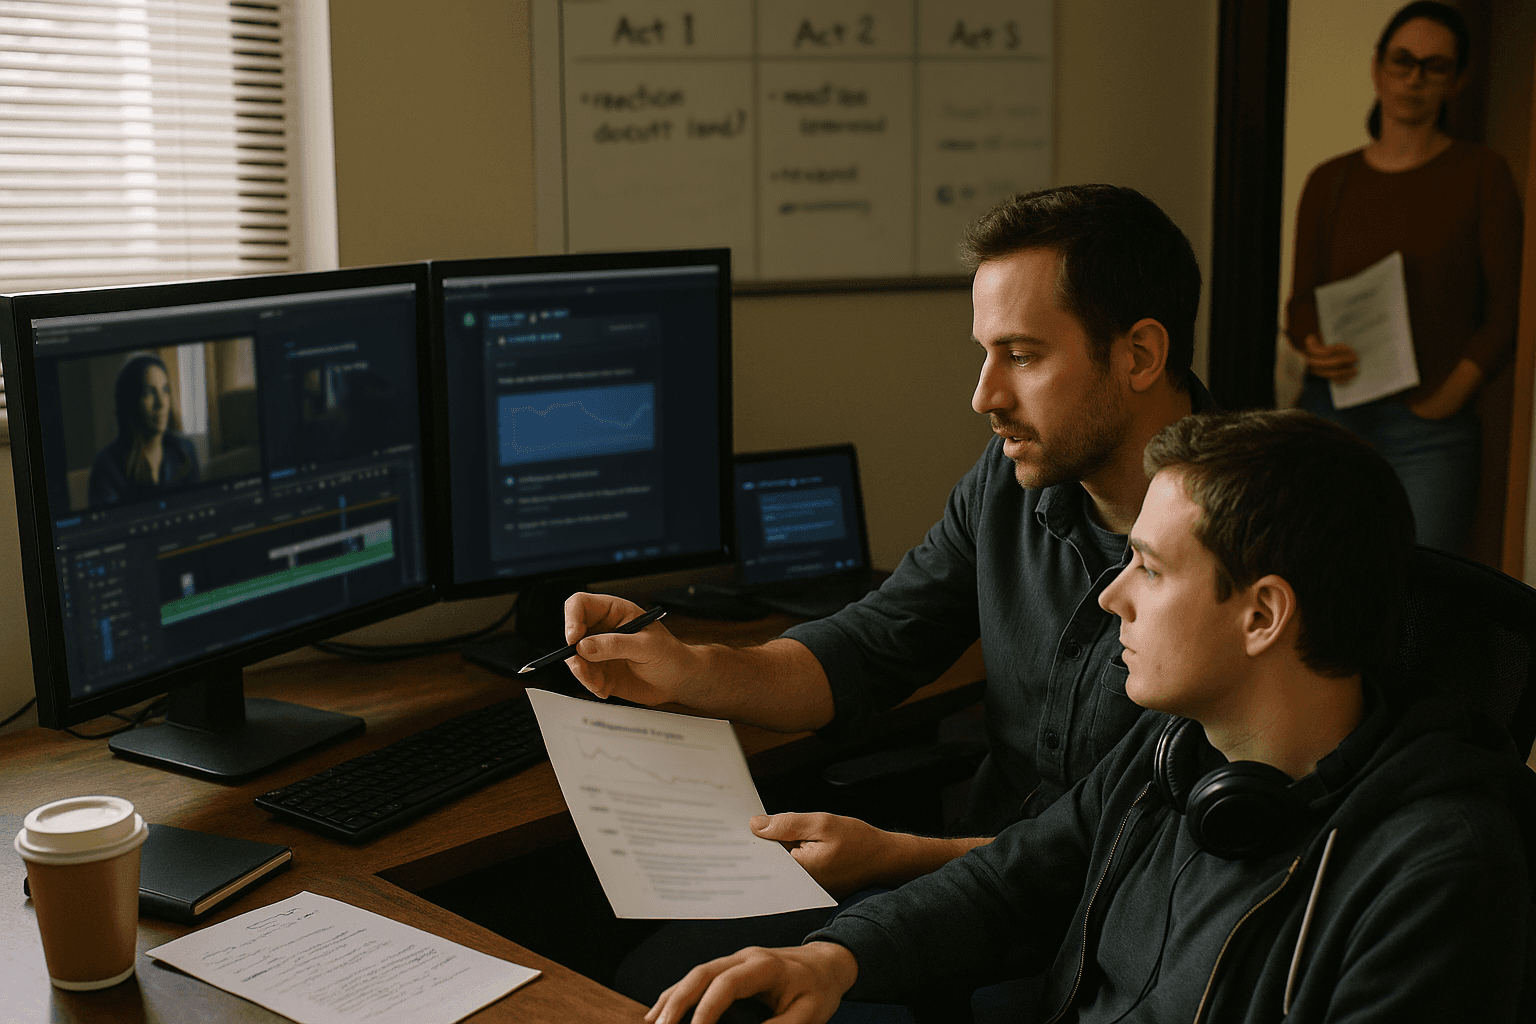
1. Segment-Level Dropoff Mapping
We synced viewing logs from our network partner (yes, the technical handshake took work) to break each episode into consistent time-stamped segments across platforms. Then we could overlay dropoff rates—for both VOD and streaming—against actual story events.
That meant editors could see:
Where viewers bailed mid-scene (not just at act breaks)
Which cast members coincided with major retention dips or lifts
Whether a comedic button actually retained audience or not
We weren’t guessing.
We were mapping.
And it turned passive data into active creative context.
2. A/B Cut Testing (Just Enough to Matter)
We ran lightweight version testing—not Netflix-scale, just within controlled focus groups—on scenes editors were unsure about. Not pilots. Not full episodes. Just 2-minute scenes, structured to test timing, tone, and payoff.
Post could move forward with confidence, not rounds of second-guessing:
Should this reaction shot breathe, or is it dragging?
Does this twist actually land, or confuse viewers?
Is this moment funnier when it builds slow or cuts quick?
A/B didn’t replace story insight—it gave it traction. We weren’t swapping creative for metrics. We were using metrics to stop spinning.
3. Engagement Reports, Not Dashboards
We didn’t roll out another dashboard no one would open. We made clean engagement briefs: one-pagers tied to each episode, shared ahead of post meetings. These covered:
Top 3 "high friction" scenes (highest dropoff or skip behavior)
Most rewound moments (on platforms that allowed tracking)
Segment-by-segment retention graphs with clear timestamps
Producers could finally point to specific moments instead of saying “act two feels soft.”
What Changed (Emotionally + Operationally)
The emotional shift was confidence.
Instead of arguing over notes or deferring to whoever had the loudest take, teams had a shared, trusted frame of reference. Editors didn’t have to guess what “wasn’t working.” They could see the data. Story producers and EPs stopped chasing feedback loops, because we had directional clarity from the start.
The operational shift was focus.
Cut reviews got faster. Networks came more prepared. And instead of defending obvious scenes or reworking well-performing sections, we could spend time fixing what we knew was dead air. Which meant tighter cuts, cleaner lock deadlines, and—on one series—a full week shaved off the post calendar.
We also saw better alignment between what marketing chose to promote and what audiences naturally gravitated toward. When they overlapped, we pushed harder. When they didn’t, we adjusted.
No one was trying to weaponize the data. It wasn’t a stick—it was a compass.
Viewer engagement isn’t magic. And it’s not mysticism either.
It just requires intention. When properly surfaced and tied to creative decisions, it doesn’t limit the process—it liberates it. Editors spend less time in the dark. Producers trust the cut. Execs have language to explain choices upstream and downstream.
No system is perfect. But if you’re building engagement metrics that your team can actually use, you’re not just chasing numbers. You’re buying back time, clarity, and the calm that comes with knowing you’re not guessing anymore.
You’re building for what works—and letting go of what doesn’t.
Quietly, cleanly, on purpose.
Not Sure What's Broken?
We’ve seen it all before. Let us show you what’s missing.